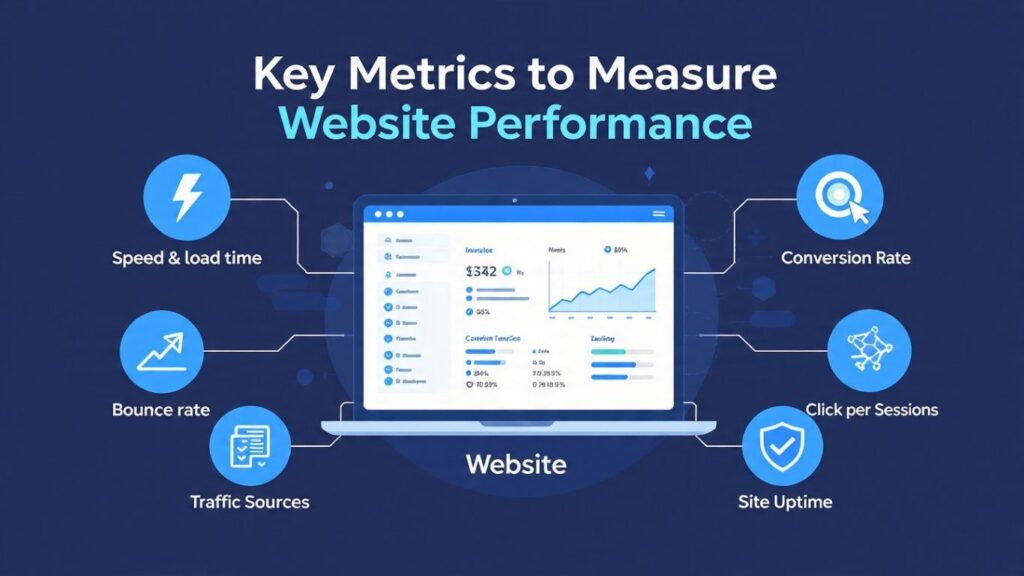
Key Metrics to Measure Website Performance
In today’s data-driven world, tracking key website performance metrics isn’t optional it’s essential. The right metrics reveal exactly how users interact with your site, what’s working, what’s not, and what to fix for better results.
What Are Website Performance Metrics?
User experience improvements
SEO strategies
Conversion rate optimization
Content planning
Technical performance fixes
Website Speed & Load Time
How fast your site loads is everything.

Page Load Time: Total time for a page to fully render.
Time to First Byte (TTFB): How long the server takes to respond.
First Contentful Paint (FCP): When the first piece of content appears.
Google PageSpeed Insights
GTmetrix
Pingdom Tools
WebPageTest
Bounce Rate
Your content doesn’t match search intent
The design or UX is off
The page loads too slowly
There’s no clear next step
While acceptable bounce rates vary by industry, a good benchmark is:
25%–40% for blogs or informational content
40%–60% for e-commerce or service sites
Improving page load speed
Enhancing your content structure
Adding compelling calls-to-action (CTAs)
Average Session Duration
This tells you how long people stay on your site and it’s a great way to gauge engagement.
More time = more interest.
A low session duration could mean
Your content isn’t engaging
Navigation is poor
Users can’t find what they’re looking for
Add video content
Break long text into digestible sections
Include interactive elements like quizzes, sliders, or tools
Pages Per Session
They’re engaged
Your site has a logical flow
You’re providing value
Adding internal links
Creating content clusters
Suggesting related posts/products
Conversion Rate

Filling out a form
Making a purchase
Downloading a guide
Booking a consultation
E-commerce: 1%–3%
Service-based: 5%–10%
Google Analytics (GA4)
Hotjar
Crazy Egg
HubSpot
Traffic Sources
Organic Search – Visitors from search engines like Google or Bing
Direct – People typing your URL directly
Referral – Visitors clicking through from other websites
Social – Traffic from platforms like Facebook, Instagram, Twitter
Paid Search – Google Ads or other paid campaigns
Email – From newsletters or promotional emails
Which platform brings the most traffic
Which brings the highest-converting traffic
Where you should invest more time and budget
Mobile vs Desktop Performance
Mobile
Desktop
Tablet
Page speed
Bounce rate
Conversion rate
Usability issues (tap targets, layout, scrolling)
Core Web Vitals (Google’s UX Metrics)
Largest Contentful Paint (LCP) – How quickly the main content loads (Goal: <2.5s)
First Input Delay (FID) – Time it takes for your site to respond to the first user interaction (Goal: <100ms)
Cumulative Layout Shift (CLS) – Visual stability during loading (Goal: <0.1)
Optimizing images
Reducing JavaScript
Using proper caching
Avoiding dynamic layout shifts
Exit Rate
Don’t confuse exit rate with bounce rate.
Bounce Rate = Single page visits (they came and left from the same page)
Exit Rate = The last page a visitor sees before leaving the site
By looking at exit rate, you can identify:
Pages that might be confusing or off-putting
Checkout or sign-up flows where users drop off
Content gaps or dead ends
If a key product page or blog post has a high exit rate, that’s a red flag worth investigating.
Top Landing Pages
Landing pages are the first touchpoint visitors see when they arrive at your site. Tracking which ones perform best helps you:
-
Understand what content attracts traffic
-
See which pages convert best
-
Optimize underperforming entry points
A top-performing landing page should:
-
Load fast
-
Have a strong CTA
-
Guide the user toward a conversion
Match the visitor’s intent
Use Google Analytics to identify high-traffic pages and review how they’re performing in terms of engagement and conversion.
Click-Through Rate (CTR)
CTR measures how often users click on links or CTAs compared to how often they see them.
You can track CTR for:
Navigation links
Buttons
Call-to-action banners
Forms
Internal links
A low CTR means people are seeing your content but not engaging. Try:
Writing better CTA copy
Using contrasting button colors
Placing CTAs higher up on the page
Click-tracking tools like Hotjar, Crazy Egg, and Microsoft Clarity show exactly what users click and what they ignore.
Site Uptime
You can’t measure performance if your site isn’t online.
Site uptime refers to how often your website is accessible to users. Aim for 99.9% uptime or better.
Downtime costs you:
Traffic
Sales
Trust
SEO rankings
Monitor uptime using tools like:
UptimeRobot
Pingdom
StatusCake
And always choose a reliable hosting provider that offers security, backups, and round-the-clock support.
Backlink Profile
Backlinks (links from other websites to yours) are a major factor in SEO performance.
Track:
Total number of backlinks
Quality of referring domains
Anchor text distribution
New vs lost backlinks
Backlinks from reputable, relevant sites boost authority and search visibility. Low-quality links can hurt rankings or even lead to penalties.
Use tools like:
Ahrefs
Moz Link Explorer
SEMrush
Focus on earning links through quality content, PR, and outreach.
Form Abandonment Rate
You’ve done everything right designed a killer form, placed it strategically, but users start filling it out and then bail.
That’s form abandonment.
This metric is critical for:
Lead generation websites
E-commerce checkout flows
Newsletter sign-ups
Contact forms
Common reasons for abandonment:
Too many fields
Confusing layout
No trust signals
Poor mobile experience
Fix it by:
Simplifying forms
Adding autofill and error messages
Including social proof
Tools like Hotjar or Formisimo help you track form interactions and drop-off points.
Your website is more than a digital brochure it’s a growth engine. But you can’t optimize what you don’t measure.
By tracking the right performance metrics not just traffic, but behavior, speed, engagement, and conversions you gain powerful insights into what your users want and how to deliver it.
Whether you’re running a blog, store, or B2B platform, consistent performance monitoring is what separates high-converting websites from forgettable ones.
Make metrics part of your routine and watch your results grow.
FAQ's
1. How often should I check my website performance?
Our website design service covers custom layouts, responsive mobile design, speed optimization, branding integration, and user-friendly navigation.
2. What tools are best for tracking metrics?
3. What’s a good bounce rate?
It varies by industry, but generally:
20–40% for service sites
40–60% for blogs
60–80% for landing pages with one action
4. Do Core Web Vitals affect SEO rankings?
Yes. Google uses them as part of its ranking algorithm. Poor Core Web Vitals can hurt visibility even if your content is strong.